I use “AlwaysUp” from Core Technologies to run and monitor programs. I believe it has ability to “kill” an app if it hogs the CPU.
I tried to work with the debugger. On my development machine it works fine and I was able to follow the directions you gave.
On the server however it doesn’t work yet. First I had to copy more Clarion DLL’s and I ended up by copying all Clarion DLL’s, but after that I was able to start the debugger.
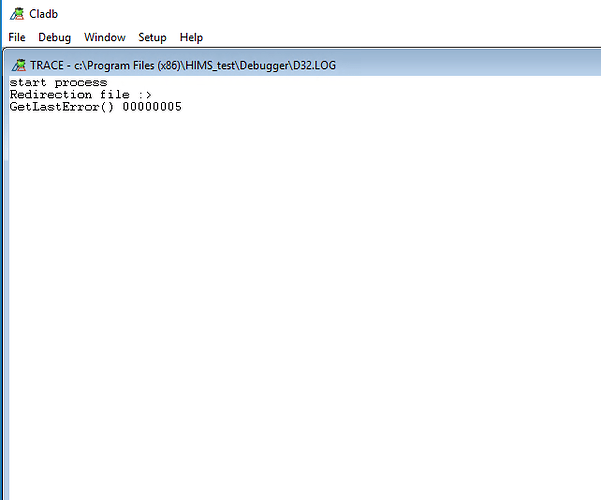
But when I start with cladb -p <pid> I am not able to open the threads list. The D32.log gives an error, but no clue what this means. I noticed a redirection file was created when starting the debugger, but that makes no sense to me. What am I missing?
I figured it out. If I try to hook into a process I started my self it works and the threads list shows up. But when I hook into the process of another user there is no threads list. Ans I have administrator rights on this server.
How can I overcome this?
05 error is “Access denied” error.
Normally I would say right-click on the exe and say “Run as Administrator” but in this case you’re trying to run it from the cmd line.
Have you tried using RunAs cmd?
Yes, I have tried that too.
Strange I don’t have access rights, I am logged in as administrator on this server. And I can log out this user if I want to.
With the help of Also I was able to solve this. In stead of starting it from the command prompt I made the debug application the System Debugger. Now I can use the context menu in the task manager and I can also hook in to processes that are started by another user.
Hi all,
Just an update on this. With the suggestions of here and in the Clarion NG was able to create a service which monitors all running instances of my application every three minutes. If the CPU usage comes above 94% three times in a row I kill the process.
It works fine. The users a satisfied with this workaround. They know that I cannot figure out the real issue yet and it will take some more time.
