How to improve the Call Stack when your program GPFs to show Procedure Names

As shown on ClarionLive (2014, Sept 19)

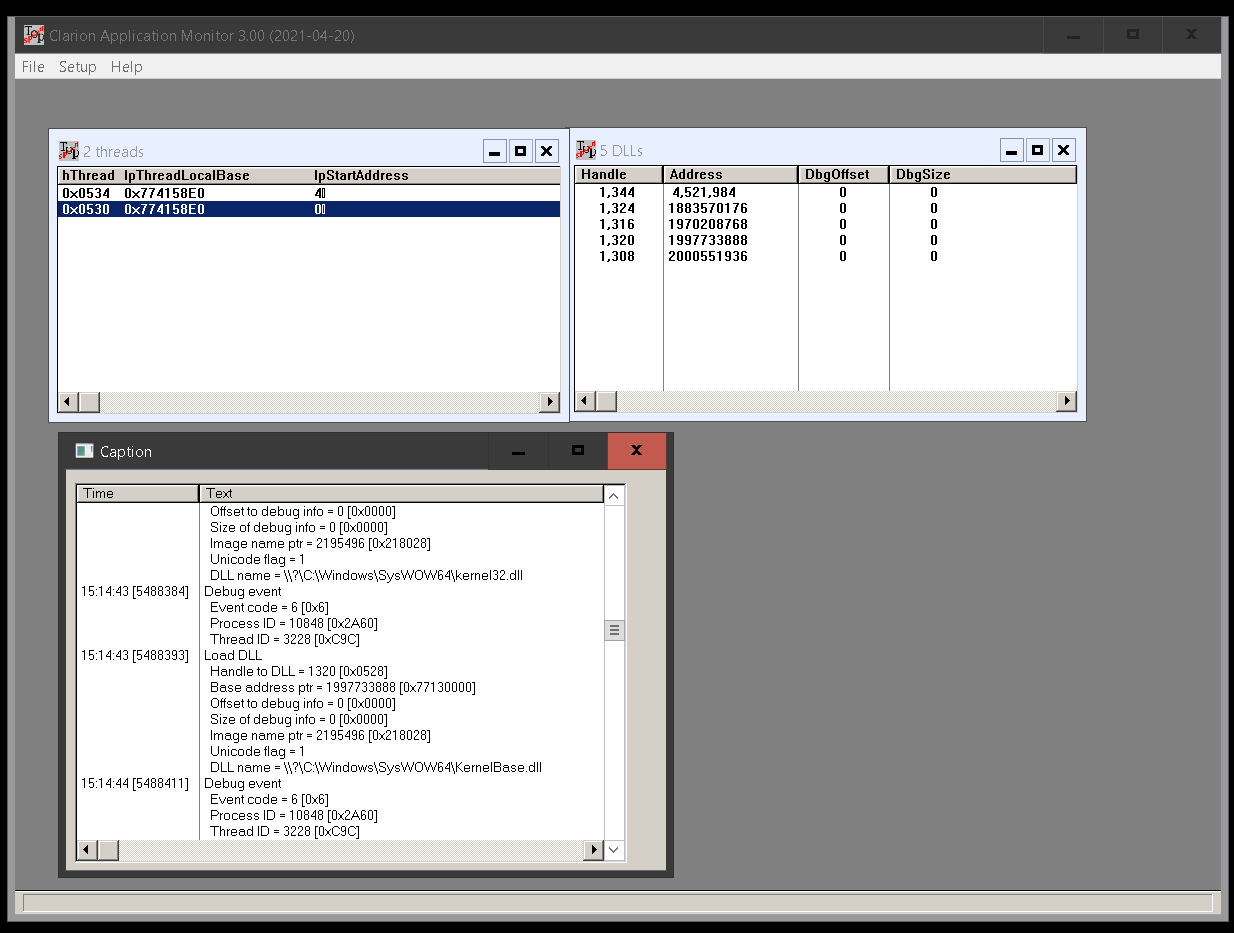
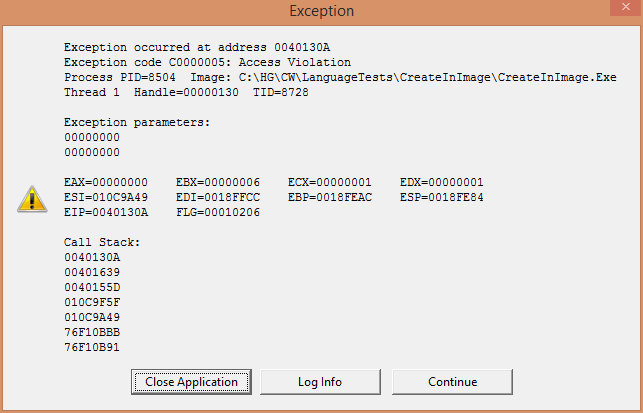
When you GPF you’re given a stack trace with several fairly useless addresses
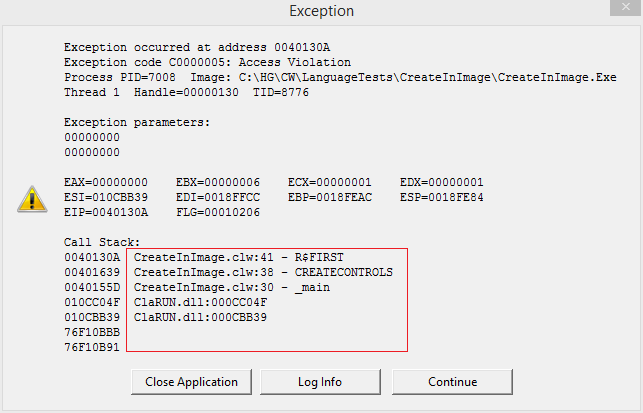
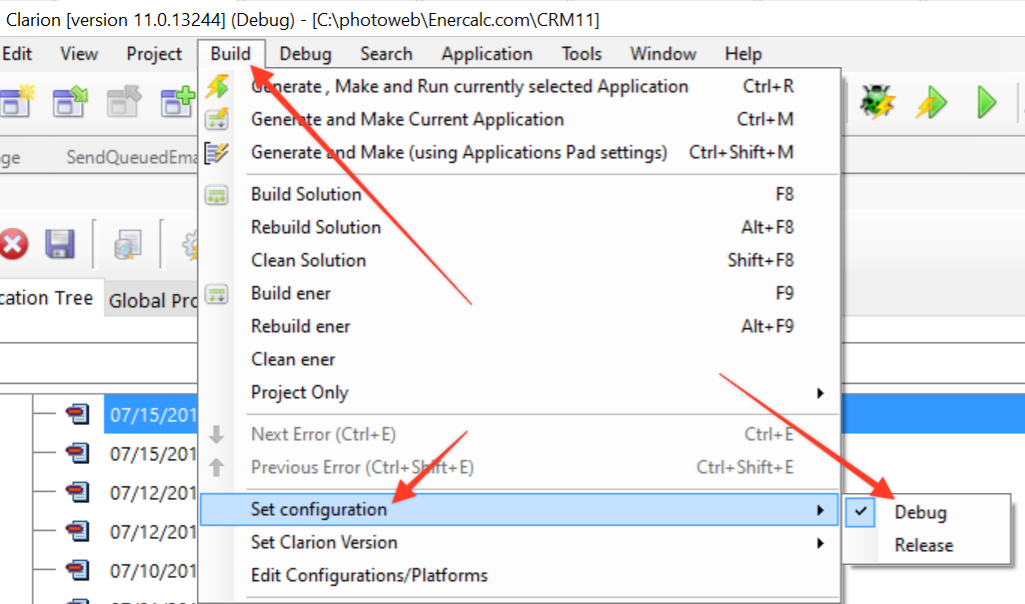
However if you’re in Debug mode and have %Bin%\Debug\ClaRun.dll in place
then in addition to the (fairly useless) addresses,
you also get the ModuleName:LineNumber -Procedure
(note: routines appear with a R$ prepended to their name)

So using the %Bin%\Debug\ClaRun.dll is a great thing.
However, every time you compile, the IDE copies over the ClaRun.dll with the %Bin%\ClaRun.dll version

So… how do you configure the IDE so it gives you the Debug version?
The answer is in your .RED file.

Below is the default %Bin%\ClaRun.dll

[Copy]
-- Directories only used when copying dlls
*.dll = %BIN%;%BIN%\AddIns\BackendBindings\ClarionBinding\Common;%ROOT%\Accessory\bin;%libpath%\bin\%configuration%

Below is the debug version - %Bin%\Debug\ClaRun.dll
basically you’re adding %BIN%\Debug; to the start of the list
%Bin% is the where you’re installed Clarion plus \Bin

[Copy]
-- Directories only used when copying dlls
*.dll = %BIN%\Debug;%BIN%;%BIN%\AddIns\BackendBindings\ClarionBinding\Common;%ROOT%\Accessory\bin;%libpath%\bin\%configuration%

If you’re compiling the RTL into your program LinkMode = Lib
Then alter your .RED to point to the debug version of ClaRunL.lib
APPARENTLY this file ships with PE, but not with EE - go figure.
See PTSS[41095] this was fixed at some point (I don’t recall which builds have this problem)

[Debug]
ClaRunL.lib = %ROOT%\lib\Debug

Now… go fix those GPF’s so you don’t have too look at this anymore.

8 Likes

I have PE here and I see that CLARUNL.LIB has been there since C8 in case that helps anyone.

Note: the original posted was edited after @ttetley pointed out that the [Debug] section for ClaRunL.lib was causing .lib to be created there.

In the IDE, get your build into debug mode like this:

Once that is done and you’ve recompiled, copy \clarion\bin\debug\clarun.dll to your application folder and then run your app again.

Isnt this like CapeSoft GPF Reporter ?

@Bruce Johnson of Capesoft has said that he often shares a link to this post while providing tech support.

I’m sure that Capesoft GPF reporter is superior to this approach certainly in terms of communicating the info back to the developers

That said I find this approach to be extremely useful

As Mark says, I direct folk to this thread all the time. (If you are here because of such advice, then welcome! :slight_smile: )

GPF Reporter obviously predated this technique, and I still use it myself because it has some advantages over the above. Specifically it’s able to (silently) restart a program after a GPF, it’s able to log the GPF to a file (which makes it handy if the GPF is occurring on a server, or client machine) and it gives more “context” to the GPF (which thread, which user, which machine, key-pressed, event and so on.)

That said, for simple GPF’s during development, which the developer can see and reproduce, the debug functions in Clarion are completely adequate and definitely should be used.

So does any one know how to do this themselves besides Capesoft? :grinning:

I’ve been looking at the debug api’s in windows Debugapi.h header - Win32 apps | Microsoft Docs and wanted to have debugview capture the lines that someone would normally step over in the debugger, and obviously debugview can log the output automatically as I think it would be useful for post mortem analysis, buts its something that could work along side existing outputdebugstringA.

I admit I havent got any further into this yet, sorting out access rights atm, but I’m intrigued in how far I can take the remote debugging api
CheckRemoteDebuggerPresent function (debugapi.h) - Win32 apps | Microsoft Docs

ie if a user on another site has a problem like the one described here Application Exception - Intermittent in C11 app - ClarionHub

I want to see if its possible to remotely debug their app from the comfort of my dev pc, hence this post and what I’ve been doing with my debugview template.

UNC is possibility, but so are vpn’s and network shares.

Back in 2010 Last Chance Hook was added to Clarion so when an Exception occurs the RTL calls back to your Handler Procedure. See the below blog entry and LibSrc\CWEXCPT.INT.

My CIDC 2017 talk “What’s New - Features in Clarion” had an example of how to use this so you can watch that video The way I use it is to write the Log first (ICWExceptionInfo.LogException(filename)) so I do not rely on the user. With the Debug RTL DLL the log will have the procedure names and lines numbers. Then display my own crash message that is geared towards end users. At start up I look for my Exception files and popup a reminder to call and report.

Read Clarion Help on PROP:LastChanceHook

http://clarion.help/doku.php?id=prop_lastchancehook.htm

Rich, it sounds what you’re talking about is effectively writing your own app that’s a very debugger that just monitors your own app (which is what Lotus Notes did/does, if you ever had the misfortune to use that).
If that’s what you’re thinking of, then in terms of APIs you want to use WaitForDebugEvent & ContinueDebugEvent
If you’ve ever used Dependency Walker in ‘profile’ mode it does the same thing to figure out what DLLs are loaded.

1 Like

I did have to use Lotus 123 and Lotus Approach but never Notes.

Yep but on demand over the web.

I’ll check those out thanks, basically there has been times in the past when an app plays up on a machine and I’ve had to install the system debugger with the appropriate source files to get to the bottom of whats going on, and this could be like just one machine out of 30 on a site that plays up.

So having a faster way to log more details over and above what is already setup in Debugview could be useful I think.

Looks like you’ve already knocked something up judging by your screen shot, I like the event monitoring, have you found some things harder to extract out windows 10 that you know of?

For example, in the attached, its getting harder to extract info out of some parts of Windows for logging purposes, the windows Settings Gear icon is a classic example of not being able to drill down into the different panes.

I haven’t tried anything on Win10, I wrote that code in '99 and to be honest I’m surprised it still works :slight_smile:

Remote logging is actually quite simple using a vendor (free) like https://honeycomb.io I demonstrated this and provided a class for sending logs/metrics to Honeycomb during one of my ClarionLive webinars. If you search the episode list Im sure you’ll find it.

This is getting off the topic of
Improving GPF Reports. I’ll split “Remote Debugging” into a new topic when I get to a PC, or another mod should.

The original Debug View allows “Remote Monitoring”.

Remote monitoring: Capture kernel-mode and/or Win32 debug output from any computer accessible via TCP/IP - even across the Internet. You can monitor multiple remote computers simultaneously. DebugView will even install its client software itself if you are running it on a Windows 2000 system and are capturing from another Windows 2000 system in the same Network Neighborhood.

https://documentation.help/DebugView/DbgviewRemote_Monitoring.htm

Logging would be different than the Debug I would output that could be verbose.

It must be 10 times a day I code for an error thinking “this can never happen”. But I check and always output obvious debug, which I never see unless the customer calls. Logging these impossible failures to Honey Comb would give me visibility.

When your apps aren’t visible (services, etc) - logging is debugging. Honeycomb (and other tools) have query / filtering capabilities. Tho I suppose apps that aren’t visible includes apps on a customer’s machine halfway across the planet:) We don’t do much of that because it creates even more support, but ODS is done locally to DBV++ saved to a file when we need it.