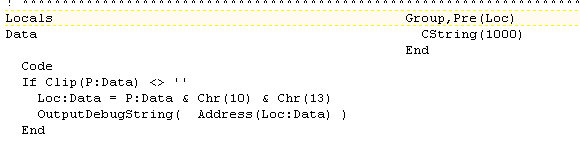
Over in this thread, (Using WTSQuerySessionInformation to get client computer name when running in a remote session - #8 by Rick_UpperPark) a few of us are discussing the use of WTSQuerySessionInformation. This API returns a address that is the offset to the return information. In this case, the return information was a null terminated string (CSTRING) and it was uncertain if the returned buffer length included the NULL character or not.
I fired up the debugger to examine the data and thought it might be interesting for others to see how I did it.
Turns out the buffer length does include the NULL character.
First, compile your application in debug mode.
I started by putting a breakpoint right after my API call.
When the debugger stops on your line of code, go to the Stack Trace window and right click on the variable containing your memory offset and pick Examine Memory. In this case BufferPtr.
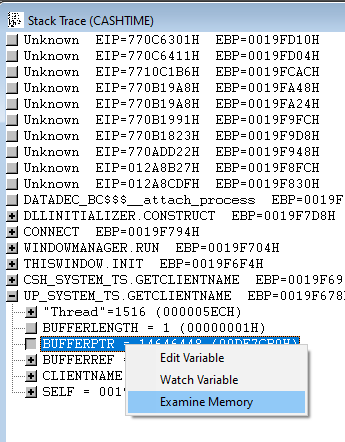
This opens a window containing the memory of your variable.

When a memory location contains the offset of another memory location, you can use the debugger to jump to that offset by right clicking on the first byte of the memory and choosing Locate Offset.
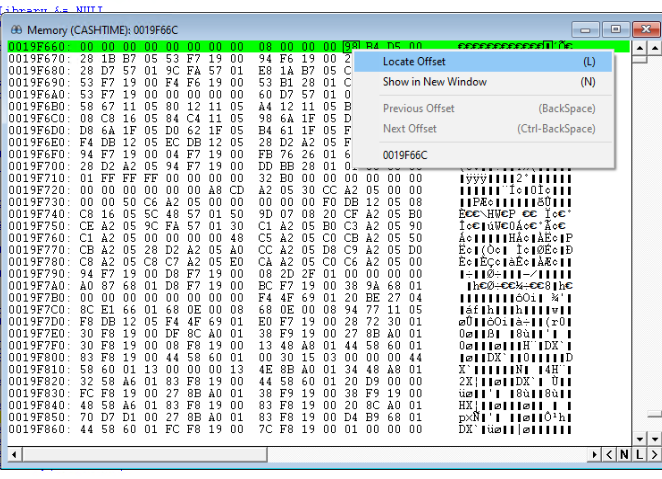
This opens a little window with the memory offset from the original locations contents. Notice that it automatically handles for you that the original memory location had the offset in little endian form and converts it for you. In the first screenshot the byte values are 98 B4 D5 00, but the locate offset window changes that to 00 D5 B4 98 for you.

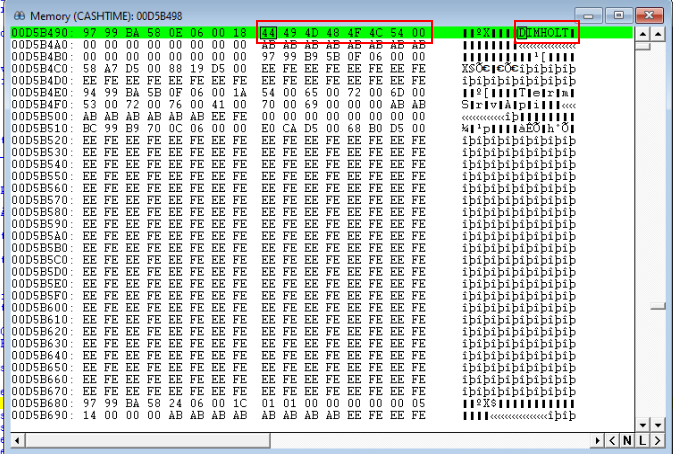
Press OK to go to the new offset and you see the new memory location that contains the data. In this case, it is the results of our API call which is my computer name DIMHOLT.
Voila, we used the debugger to dive into the memory offsets returned by the API call.
Our original question, was did the returned Buffer Length include the NULL terminating character.
We can see here that the buffer length returned is 8, which is 1 more than the 7 character computer name. My original code made the incorrect assumption that the buffer length did not contain the NULL character, so my code was allocating 9 characters for the return value. You can see below that was not necessary and there are two NULL characters at the end of the CSTRING.